A report released on Dec. 12 by Descartes Systems Group found that container import volumes declined to levels close to those in 2019. >
Port delays continue to decrease, but major East and Gulf Coast ports still have extended wait times versus major West Coast ports. Key economic indicators during this period paint a conflicting picture about their impact on future import volumes and, combined with COVID, the Russia/Ukraine conflict and the West Coast labor situation, continue to point to further disruptions and challenging global supply chain performance going into 2023.
November 2022 U.S. container import volumes declined 12.0% from October to 1,954,179 TEUs (see Figure 1). Versus November 2021, TEU volume was down 19.4%, and only 2.8% higher than pre-pandemic November 2019. Note that November is a shorter month (30 days) and contains the U.S. Thanksgiving holiday, both of which can negatively impact container import volumes.
“The November U.S. container import data reaffirms that the pressure on supply chains and logistics operations has begun to lift, but there are still a number of issues that may cause further disruptions in 2023,” said Chris Jones, EVP Industry& Services at Descartes.
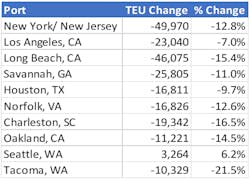
Looking at the top ten ports, all saw volume decline except for the Port of Seattle.
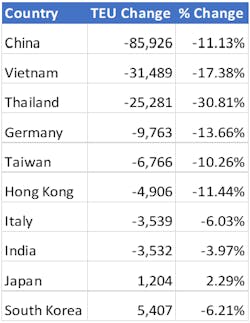
The downward trend continued in November for U.S. container imports from China to 686,514 TEUs, a reduction of 11.1% versus October and down 31.5% from the 2022 high in August. China represented 35.1% of the total U.S. container imports, a decline of 6.4% from the high of 41.5% in February 2022. Of the top 10 countries importing into the U.S., Vietnam, Thailand and Germany on a percentage basis fared worse than China in November versus October .


