Global demand for e-commerce fulfillment centers and distribution centers fueled a 2.8% year-over-year increase in prime logistics rents globally, led by double-digit percentage gains in U.S. coastal markets, according to CBRE Group’s Global Prime Logistics Rents report.
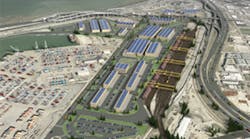
Six of the top 10 markets with the fastest growing prime logistics rents globally were in the U.S., led by Oakland, Calif., with a nearly 30% gain.
While American seaports and inland ports aren’t among the world’s most expensive for logistics rents, they did post the largest gains in 2015 due mostly to the increasing flow of goods into and throughout the region from online sales.
“Global consumer demand is strong, and an ever-increasing share of retail sales are taking place online,” said Richard Barkham, CBRE’s global chief economist. “That is prompting traditional retailers, e-commerce companies and third-party logistics firms to seek out advanced ‘prime’ logistics warehouses to modernize their supply chains and thus facilitate the rapid delivery of goods.”
In addition to Oakland in the No. 1 spot, U.S. cities in the top 10 for fastest growing prime logistics rents include New Jersey at No. 2; the Inland Empire at No. 3; Los Angeles-Orange County at No. 7; Dallas-Fort Worth at No. 8; and Atlanta at No. 9.
The sharp rise in prime rents in the Americas was largely due to massive growth in U.S. coastal markets, where relentless occupier demand drove up pricing. In Oakland, desire for quality premises is the dominant factor for inner-bay logistics users despite the high cost. New development in some markets, such as the Inland Empire, is commanding premium rates.
Another two of those top 10 for rent increases are elsewhere in the Americas: Santiago, Chile, and Ciudad Juárez, Mexico.
In Latin America, Santiago and Ciudad Juarez notched increases in prime rent of 10.9% and 10.2%, respectively. In São Paulo, prime rents were down 10.5% year-over-year.
Overall, growth in prime logistics rents in the Americas last year (up 5.6%) outpaced that in Asia (up 2.5%) and in Europe, the Middle East and Africa (up 0.8%). Prime rents are the highest achievable rents for a logistics facility of the highest quality and specification.
Much of the upward pressure in rents in logistics markets in the Americas and globally is stoked by a supply chain arms race of sorts among retailers, shippers and suppliers seeking accommodate the continued growth of e-commerce. In heavy demand are modern distribution centers and fulfillment centers with features such as a high loading dock ratio and clear ceiling heights of at least 26 feet to accommodate high-tech stacking racks and automated storage-and-retrieval systems. Many such facilities are being built close to large population centers, where land costs are high.
Global Pricing
Still, American logistics markets have a lot of ground to make up before they rank among the world’s most expensive. That distinction goes to densely populated markets with higher land costs. Last year’s most expensive markets are led by Hong Kong with an annual prime rent of US$28.94 per sq. ft. per annum, Tokyo ($16.74), London ($16.36), Singapore ($10.91) and Stockholm ($9.90). The most expensive market in the Americas was Los Angeles-Orange County, ranked 12th globally at US$8.04 per sq. ft. per annum.
CBRE tracks prime rents in 68 logistics hubs around the world. Fifty-nine percent (40 markets) of tracked markets saw year-over-year increases in rents, 25% (17 markets) saw no change and only 16% (11 markets) saw decreases. To focus this report solely on prime facilities, CBRE limited its scope to buildings larger than 100,000 sq. ft. (10,000 sq. m.), with ceiling heights greater than 26 to 36 feet (eight to 10 meters) and a loading-dock ratio of one dock to 10,000 sq. ft., among other criteria.


