Looking Back: How the Pandemic and Extreme Weather Events Changed the Supply Chain
Supply chain shortages have only recently become a trending topic industry-wide due to production issues and rising demand for many of our favorite items. This can be mostly attributed to factors such as the COVID-19 pandemic or even extreme weather events. However, these recent events were only the tip of the iceberg. Many companies lacked visibility into their supply chain for years, especially in the oil and gas industry, which prevented them from seizing on strategic opportunities within their business. It only took global supply chain shortages due to a pandemic and unprecedented weather events to expose the deficiencies.
Lockdowns & Consumerism
Global commodities have seen major price fluctuations, with energy taking the brunt of the impact. Three key factors influenced unexpected pricing scenarios in early 2020: demand, inventory and capacity.
Lockdowns in early 2020 decreased energy demand significantly. The U.S. Energy Information Administration (EIA) details that “the U.S. consumption of petroleum products had fallen to its lowest level in decades due to COVID mitigation efforts,” according to the EIA. During this period, most travel (on- and off-road) screeched to a halt, and energy production eventually slowed, driven mostly by demand and region-specific lockdown mandates.
The oversupply was met with an immediate lack of demand resulting in historically low natural gas and negative crude prices. For crude, inventories were filling up quickly and producers were hesitant to stop production. As of March 2020, “low refinery runs had contributed to record increases in U.S. commercial crude oil inventories. From March 13 to April 24, U.S. crude oil inventories saw a 16% increase, up by 73.9 million barrels. U.S. crude oil inventories are now higher than the previous five-year average for this time of year,” according to the EIA. This scenario was costly for futures traders who were practically paying to get rid of crude oil.
The lockdowns and decreased fuel demand also impacted refinery capacity across the U.S. “U.S. refineries have reduced gross inputs (runs), which dropped to 12.8 million barrels per day (MMbbl/d) for the week ending April 17, 2020, 3.8 MMbbl/d lower than the previous five-year (2015–19) average and the lowest level since 2008,” the EIA noted. Specifically, five U.S. refineries were permanently shut down due to gasoline consumption decreases and pandemic-led lockdowns.
These closings decreased capacity down to a level below 2016’s 18.3 million barrels per day and reflected a 4.5% annual decrease. Of the five closures, two refineries were converted to renewable diesel plants. Though these closures were jump-started by the pandemic, many believed that these refineries were to be shut down eventually due to operational costs.
As 2020 progressed, prices began to correct and global restrictions eased. This caused travel demand to increase globally. However, demand, inventory, and capacity were already affected by extreme weather events across the globe.
Extreme Weather Events
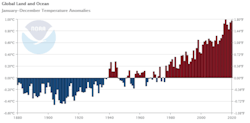
The second knockout punch during the pandemic was attributed to extreme weather events and their effects on the supply chain. According to NOAA’s Global Climate Report, the decadal climate was well above average by about 1.48 degrees Fahrenheit (Figure 1).
One such effect was intense heat, specifically in the Pacific Northwest. The heat combined with drought conditions fueled major fires throughout 2020 and 2021 that directly affected commodities such as lumber. British Columbia is home to the two largest lumber producers in the world, producing more than 15 million cubic meters per year. The major fires wiped out supply and diverted resources away from lumber production due to a provincial state of emergency. This caused many transportation backlogs in the region, specifically delaying rail into Canada’s largest port in Vancouver.
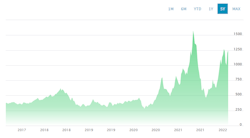
If that wasn’t enough, consumers were still reeling from the Canadian government-mandated lockdowns and an increase in demand from DIY projects and the active housing market. At the beginning of the pandemic, Canada’s top two producers responded to the pandemic with output curtailments due to COVID restrictions from the Canadian government. The ripple effect from the production shutdown, logistics cutoffs due to intense fires, and the rise in housing demand and at-home DIY projects caused a full-blown supply chain crisis. As expected, this caused prices to soar to all-time highs (Figure 2).
In another example, the natural gas industry also experienced extreme volatilities. Though the global temperatures trended warmer, Europe and North America saw extremely cold temperatures in early 2021. Many parts of Europe experienced record snow in January and North America saw a historical arctic outbreak in February. In the U.S., these freezing temperatures inundated the deep South for almost five days.
“Dallas experienced its second-longest streak of temperatures at or below freezing and at or below 20 degrees and reached its third-coldest temperature on record: minus-2 degrees,” according to a report published in the Washington Post. Due to the freezing temperatures, any measurable snow or ice did not quickly melt.
This resulted in record-high demand on an already-strained Texas power grid. Regulated by ERCOT, power generation in the state was halted due to the lack of winterized facilities leaving 70% of ERCOT customers without power. Since about 46% of Texas power was generated by natural gas, spot prices skyrocketed.
Meanwhile, Europe is seeing natural gas price increases at a much higher rate each year. Aside from weather events, Europe has seen natural gas price hikes due to inventory shortages and political tensions with Russia, a primary supplier. Since the region is dependent on imports, prices have increased nearly 9 times since early 2021. Current sanctions on Russia’s energy industry will continue to influence price volatility globally.
Taking Action To Effect Positive Change
With weather patterns changing constantly and the pandemic-induced restrictions easing, all industries must adopt supply chain visibility. First, this entails understanding the current condition of your company’s supply chain through some form of digital transformation. The term digital transformation refers to the integration of technology to improve areas of your business, such as supply chain management. This term forces us to ask the following questions: Are your current systems operating as planned and successfully integrated? Do you have reporting in place that allows you to collect and analyze your data across all systems? Is your company operationally cohesive outside of technology? If not, this may mean changes are required to promote a successful digital transformation within your business.
However, it’s not as simple as a new system implementation. Some companies implement a new system to manage multiple areas of their business only to find performance issues continue. This can be caused by a lack of integration among multiple systems and operational gaps outside of any one particular technology.
Once systems are digitally integrated, operational business processes can be assessed. This includes current risks for supply chain failure and future vulnerability to external factors. Process complications such as bottlenecks, inventory imbalances and even incorrectly perceived demand will be identified in real-time. With reporting and analytics, businesses can also identify future vulnerable spots within infrastructure for manufacturing, refining, storage of inventory, and logistics of transportation. This prevents any major supply chain failure caused by external events such as weather, political sanctions, or even war.
After identifying and resolving current issues within the supply chain, reporting and metrics can be used further to forecast and optimize. Understanding budgets and forecasts predicated on actual, not perceived, demand by geographic region is essential. Any logistical operations can be optimized as well through efficient scheduling and operational coordination.
Digital transformation is key to gaining critical visibility and insight into the overall supply chain. While digital transformation may not stop the next global pandemic or prevent extreme weather events, it will, however, provide valuable insight into inventory levels, logistical capacity, labor figures and customer demand to spur actionable decision-making. Only then can contingency planning and policies be put into effect.
Samuel Stewart is a manager in consulting firm Opportune LLP’s Process & Technology practice based in Houston. His focus involves supply chain optimization across all energy sectors. He has worked with a variety of clients to redefine failing business processes and operational deficiencies. He has completed several successful ION RightAngle implementations and is also a certified Salesforce Sales Cloud and Service Cloud consultant.


